20+ Console Methods That Will Revolutionize Debugging For You
March 21, 2022
You are probably aware of the console.log method and maybe a few other console methods like console.error and console.dir, but there are actually over 20 console methods available for you to use. Each of these methods has their own use cases and if you use the right method for each use case you will drastically increase the quality of your debugging.
I decided to break down this article into 4 distinct sections.
- Basic logging
- Format logging
- Performance logging
- Utility logging
Each of these sections covers a handful of methods geared towards the overarching goal. These sections also include tons of general debugging tips and tricks which you do not want to miss out on.
If you prefer to learn visually, check out the video version of this article.
Basic Logging Methods
To start with we need to talk about the 5 basic logging methods.
logdebuginfowarnerror
Each of these methods work exactly the same way. The only difference is how they are displayed within the console. Let’s look at an example of using each of these methods to compare their output.
console.log("Log")
console.debug("Debug")
console.info("Info")
console.warn("Warn")
console.error("Error")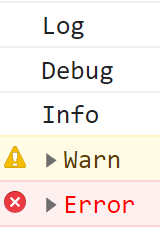
Left: Google Chrome consoleRight: Firefox console
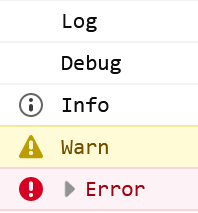
If you try this out yourself you may not see some of the logging messages. That is because you can show/hide different logging levels within the browser console. These are generally configured above the console window.

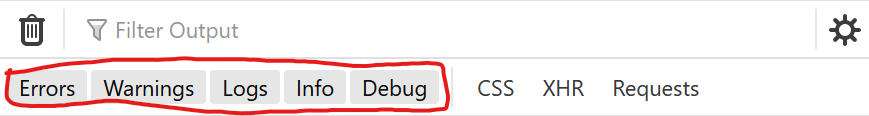
Top: Google Chrome consoleBottom: Firefox console
This ability to show/hide different logging levels is one of the reasons these various logging methods are so useful. You can easily configure what you want to show so if you are only looking for errors you can turn off all the logging levels that are not error which makes it easier to digest what is going on.
Basic Syntax
Now the basic way to use these methods is to just pass a single string or value into the method. This will log that value out in the console. You can go beyond just logging a single value, though. If you want to log multiple values you can do that in one log method by just passing them all as separate arguments.
console.log("Hello", "World", { name: "Kyle" })
// Hello World {name: 'Kyle'}
This will work for any of the 5 basic logging methods and is a great way to log related values all on the same line instead of logging each value on its own line by using multiple log methods.
Live View Issues
One thing that browsers do to try and help with debugging is always show the live up to date value for any object logged to the console. This means if you run the below code and look at the console you may see different outputs depending on when you look at the console.
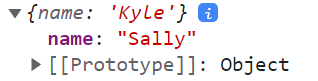
const person = { name: "Kyle" }
console.log(person)
person.name = "Sally"
In Chrome when you expand an object in the console that is when it calculates the value to be printed to the console. That means if you expand the person object within the console before running the code to change the name to Sally it will appear as expected even after you change the name to Sally. If you expand the person object after you change the name to Sally, though, you will see that the name of the person object that was logged to the console is Sally instead of Kyle which was the actual value when you logged out person.
This is sometimes what you want since all you care about is the most up to date value, but many times you want to know what the value of that object was at the time that it was logged to the screen. An easy way to fix this issue is to just clone the object before logging it to the screen.
const person = { name: "Kyle" }
console.log({ ...person })
person.name = "Sally"
The above code will work if your object does not have any nested objects/arrays. If you have objects/arrays nested inside your object you will need to either write your own method to deeply clone the object or just serialize to/from JSON.
const person = { name: "Kyle" }
console.log(JSON.parse(JSON.stringify(person)))
person.name = "Sally"
Advanced String Logging
The last thing we need to cover with these basic logging methods before moving onto the more unique methods is how to do advanced styling. Sometimes the basic styling of printing out strings/values is not quite enough and you need fine control over how the output is printed to the screen. This can be done in 2 main ways.
First you can use string formatting to format how the content is placed and printed within a string.
console.log("String: %s, Int: %d, Decimal: %f, Object: %o", "Hello", 1, 0.1, {
  name: "Kyle",
})
// String: Hello, Int: 1, Decimal: 0.1, Object: {name: 'Kyle'}
In the above example we are using %s, %d, %f, and %o as placeholders for where values should be inserted into the output of our console. When you use these placeholders the next values passed to the log method will be printed where those placeholder values are. %s is for string placeholders. %d is for integer placeholders. %f is for decimal placeholders. %o is for object placeholders.
Now this is a pretty cool feature, but honestly it is not something I use much since I can just use tagged template literals instead.
console.log("String: %s", stringVariable)
console.log(`String: ${stringVariable}`)
// Same output
If you are unfamiliar with this syntax you can check out my complete tagged template literals article.
The second type of formatting is much more useful and that is because it allows you to write custom CSS for styling your logs.
console.log(
  "Normal, %cRed, %cGreen",
  "color: red",
  "background-color: green; color: white"
)
The %c symbol tells the log method to apply whatever CSS styles are passed as the next argument to the log method to all the text that comes after the %c. These styles will apply all the way up to the end of log method or until the next %c symbol is used. This is perfect if you want to have a really fancy console message for particular use cases.
Format Logging Methods
Now that we are finally done talking about the basic logging methods we can talk about some more advanced logging methods starting with some basic log methods that change how the output is formatted.
dir
The dir method is very straight-forward in that it works nearly identically to the log method, but with one exception. The log method will output HTML elements as HTML which can be traversed while dir will log everything as if it were JSON. This means that HTML elements will be logged just like an object when using dir which makes it incredibly useful for viewing properties on an HTML element.
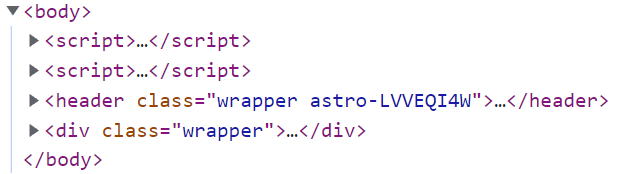
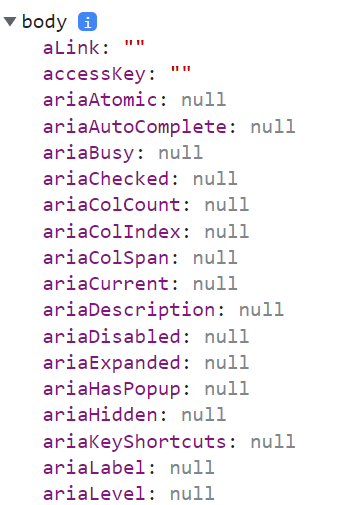
Left: console.log(document.body)Right: console.dir(document.body)
table
The table method is useful for display an array of objects in a tabular format which makes it easier to scan across small datasets.
const people = [
  { name: "Kyle", age: 27, programmer: true },
  { name: "Sally", age: 15, programmer: false },
  { name: "John", age: 34, programmer: false },
  { name: "Beth", age: 72, programmer: true },
]
console.table(people)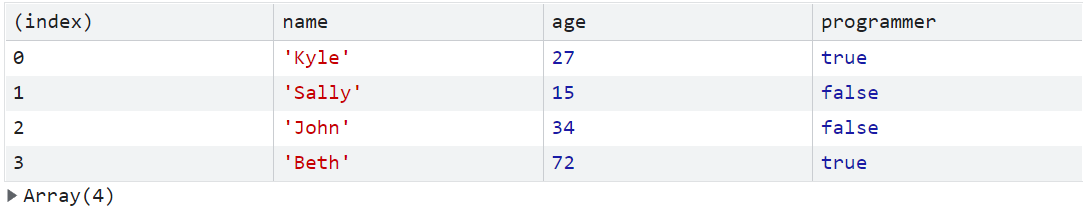
This makes scanning your list to see differences between elements in the array easier. You can also sort by specific columns in the table by just clicking on the header of the table if that feature is supported in your browser dev tools.
Grouping
The final way to format console output is with the 3 group methods.
groupgroupCollapsedgroupEnd
The names of these methods are pretty self explanatory in that the group and groupCollapsed methods both start a group with the only difference being that the groupCollapsed method defaults to having the group closed in the console while group defaults to having the group open. The groupEnd method then closes off the current group. Every log that occurs between the start and end of a group will be put inside that group. Let’s look at an example.
console.log("Outside")

console.group()
console.log("Inside First Group")
console.log("Still Inside First Group")
console.groupEnd()

console.group("Label")
console.log("Inside Second Group")

console.groupCollapsed()
console.log("Inside Nested Group")
console.groupEnd()

console.log("Still Inside Second Group")
console.groupEnd()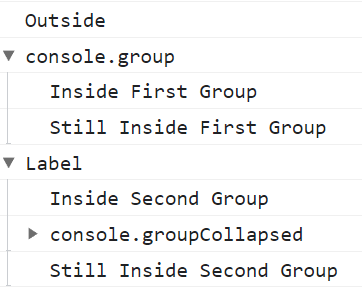
In the above example we created 3 different groups. The first group had no value passed to the group method so it just gets a default label. The second group we passed a label of Label to the group method so in the output you can see that it has that label associated with the group. We also put a collapsed group inside this group to showcase that you can nest groups inside of groups as much as you want. You can also see that the collapsed group is not open by default in the output.
These group methods are great if you need to output a large amount of information that is related, but you don’t want it to fill the entire output of the console.
Performance Logging Methods
The next group of console methods I want to talk about are the performance focused methods. These can be split into two groups.
- Timing Related
- Profiler Related
Time Based Logging
The first group is the simplest to understand since all it deals with is calculating the time between two function calls. It also works very similarly to grouping.
console.time()
slowFunction()
console.timeEnd()
// default: 887.69189453125 ms

console.time("Label")
slowFunction()
console.timeEnd("Label")
// Label: 863.14306640625 ms
We start a timer just like we start a group. We can pass it a label if we want and that will associate our timer with that label. The only difference between timers and groups is that if you give your timer a label you need to also use the same label when you end the timer. This is because you can run multiple different timers at once and the label is used to determine which timer to stop.
Timers also have a neat function called timeLog which lets you print out the current time of the timer without ending it.
console.time("Label")
slowFunctionOne()
console.timeLog("Label")
slowFunctionTwo()
console.timeEnd("Label")
// Label: 920.578125 ms
// Label: 1855.43896484375 ms
Again just like with timeEnd you need to pass the label to timeLog so it knows what timer to use.
Profiler Logging
Now if you want to take your performance logging to the next level you can use profiler logging which works just like the time based logging from above, but instead of using a starting/stopping a simple timer it starts/stops the profiler built into the dev tools of your browser.
console.profile()
slowFunction()
console.profileEnd()

console.profile("Label")
slowFunction()
console.profileEnd("Label")
This will launch the profiler in your browser dev tools and record a bunch of performance related information. Now depending on your browser this information is located in a different location and displayed in a different way. Also, this is a non-standard feature so some browsers may not support this or may handle it in a strange way. Because of this I generally wouldn’t recommend using this method unless you know how it works with your browser.
Lastly, before we move on I should mention that just like with time based logging you can use the timeStamp method to add a marker in your profiler so you can see how long it took to get to that point.
console.profile()
slowFunctionOne()
console.timeStamp()
slowFunctionTwo()
console.profileEnd()
Utility Logging Methods
The final group of console methods I want to talk about don’t really fit into any of the above categories, but they are still incredibly useful.
assert
Probably my favorite console method of this group is assert. This works exactly the same as the basic console methods, but it takes a boolean as the first parameter. If this boolean is true it will not do anything and essentially skip the log completely. If the boolean is false then it will log everything passed to the assert method after the boolean parameter. It is essentially like wrapping your log inside an if statement.
console.assert(n === 1, "Not equal to one")
if (n !== 1) console.error("Not equal to one")
// Same output
This method is perfect for testing values to see if they are what you expect which can make your logs much cleaner if you only log when something is unexpected.
clear
This method is as simple as it sounds. It just clears all values from the console.
console.clear()count and countReset
The count and countReset functions make it easy to count the number of times the value was logged. This works somewhat similarly to timers.
console.count()
console.count()
console.countReset()
console.count()
// default: 1
// default: 2
// default: 1

console.count("Label")
console.count("Label")
console.countReset("Label")
console.count("Label")
// Label: 1
// Label: 2
// Label: 1
The count function takes an optional label to denote what you are counting and then if you want to reset the count you must pass the same label to the reset function.
trace
The last console method I want to talk about is trace. This is a very simple function that just prints out the current stack trace at the point the method is called.
This is great for debugging what functions are calling other functions and to figure out how you got to a specific location in the code.
Conclusion
I bet you didn’t expect there to be this many console methods. I know I was pretty surprised by the sheer quantity of unique methods when I started my research for this article. Hopefully, at least one of these new methods will help take your debugging skills to the next level.